---
title: "Indian Fuel price dashboard "
output:
flexdashboard::flex_dashboard:
theme: flatly
orientation: rows
social: menu
source_code: embed
vertical_layout: fill
---
```{r setup, include=FALSE}
library(flexdashboard)
library(tidyverse)
Diesel <- read.csv("https://open-oven.github.io/India-Fuel-Price-Updater/data/Diesel.csv")
Petrol <- read.csv("https://open-oven.github.io/India-Fuel-Price-Updater/data/Petrol.csv")
petrol_latest <- slice(Petrol, 1L)
diesel_latest <- slice(Diesel, 1L)
```
Last update: `r petrol_latest$Date` ... Source: [India fuel dashboard - github](https://github.com/arungop/India-fuel-dashboard)
# Delhi
Row {data-height=350}
-------------------------------------
### Today's Petrol price
```{r}
valueBox(petrol_latest$Delhi,icon = "fa-gas-pump")
```
### Today's Diesel price
```{r}
valueBox(diesel_latest$Delhi,icon = "fa-gas-pump",color = "success")
```
Row {.tabset .tabset-fade }
-------------------------------------
### Petrol Price
```{r}
Petrol$Date <- as.Date(Petrol$Date)
Pd <- ggplot(Petrol, aes(x = Date, y = Delhi)) + # Draw ggplot2 plot
geom_area( fill="#69b3a2", alpha=0.4) +
geom_line(color="#69b3a2", size=2) +
ylab("Price")+
ggtitle("Surging Petrol price in Delhi")+
scale_x_date(date_labels = "%Y-%m")+
theme_minimal()
Pd
```
### Diesel price
```{r}
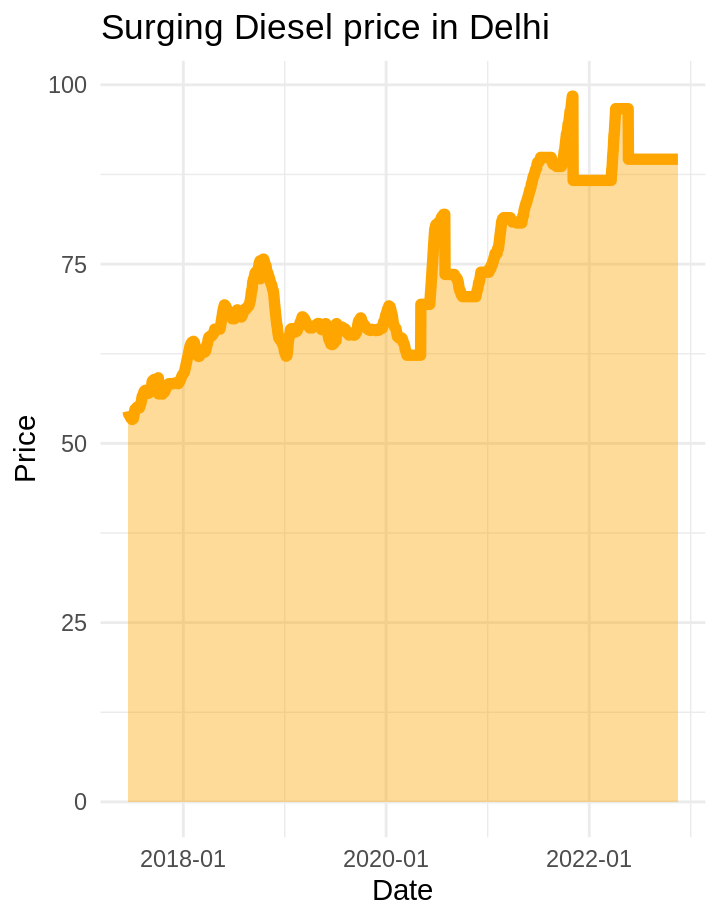
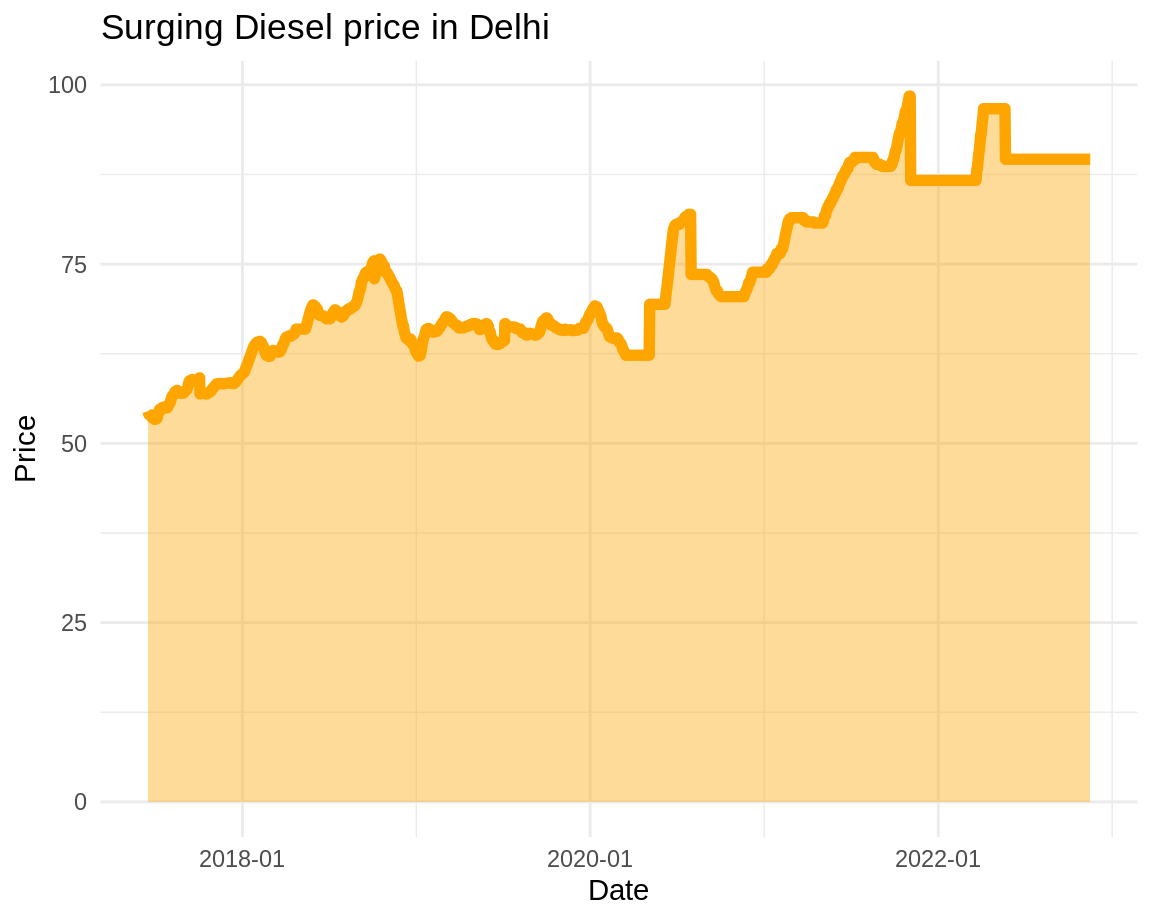
Diesel$Date <- as.Date(Diesel$Date)
Dd <- ggplot(Diesel, aes(x = Date, y = Delhi)) + # Draw ggplot2 plot
geom_area( fill="#FFA500", alpha=0.4) +
geom_line(color="#FFA500", size=2) +
ylab("Price")+
ggtitle("Surging Diesel price in Delhi")+
scale_x_date(date_labels = "%Y-%m")+
theme_minimal()
Dd
```
# Mumbai
Row {data-height=350}
-------------------------------------
### Today's Petrol price
```{r}
valueBox(petrol_latest$Mumbai,icon = "fa-gas-pump")
```
### Today's Diesel price
```{r}
valueBox(diesel_latest$Mumbai,icon = "fa-gas-pump",color = "success")
```
Row {.tabset .tabset-fade}
-------------------------------------
### Petrol Price
```{r}
Petrol$Date <- as.Date(Petrol$Date)
Mp <- ggplot(Petrol, aes(x = Date, y = Mumbai)) + # Draw ggplot2 plot
geom_area( fill="#69b3a2", alpha=0.4) +
geom_line(color="#69b3a2", size=2) +
ylab("Price")+
ggtitle("Surging Petrol price in Mumbai")+
scale_x_date(date_labels = "%Y-%m")+
theme_minimal()
Mp
```
### Diesel price
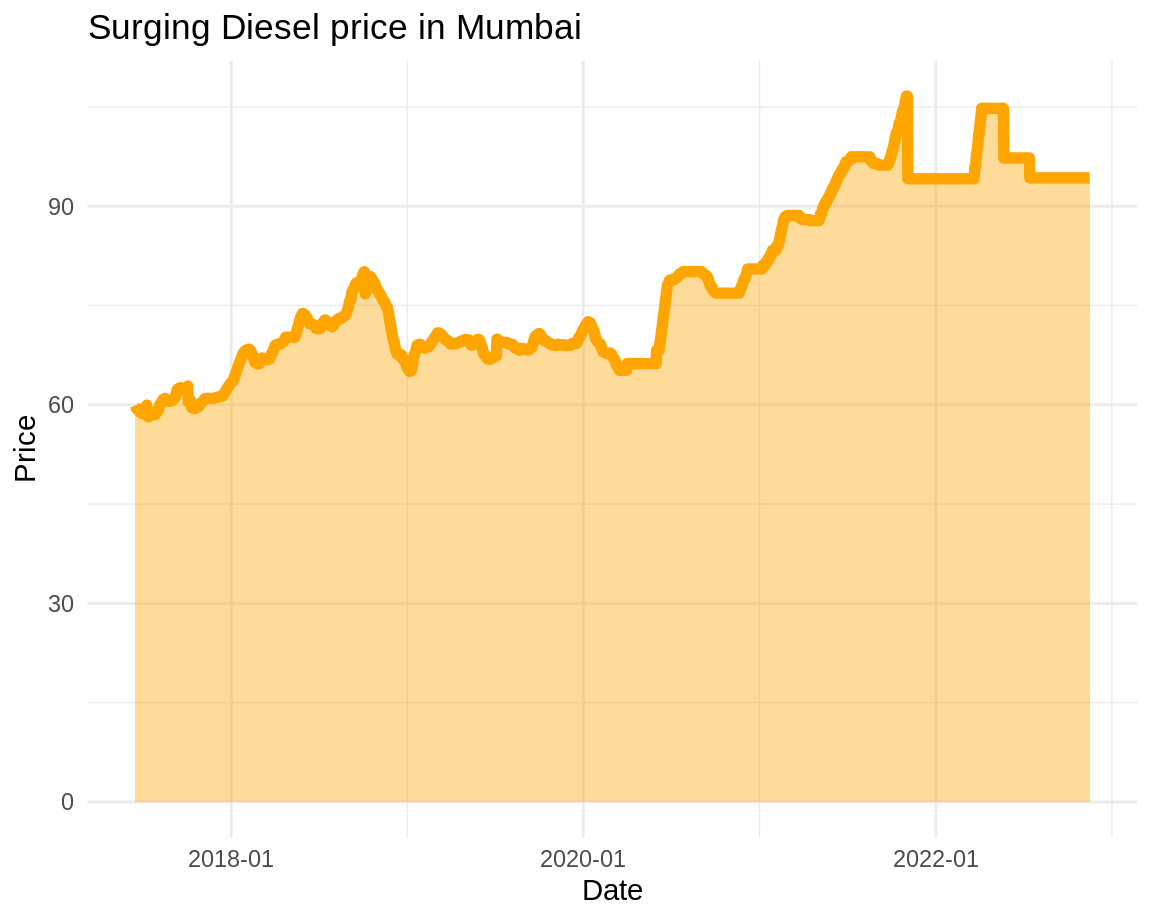
```{r}
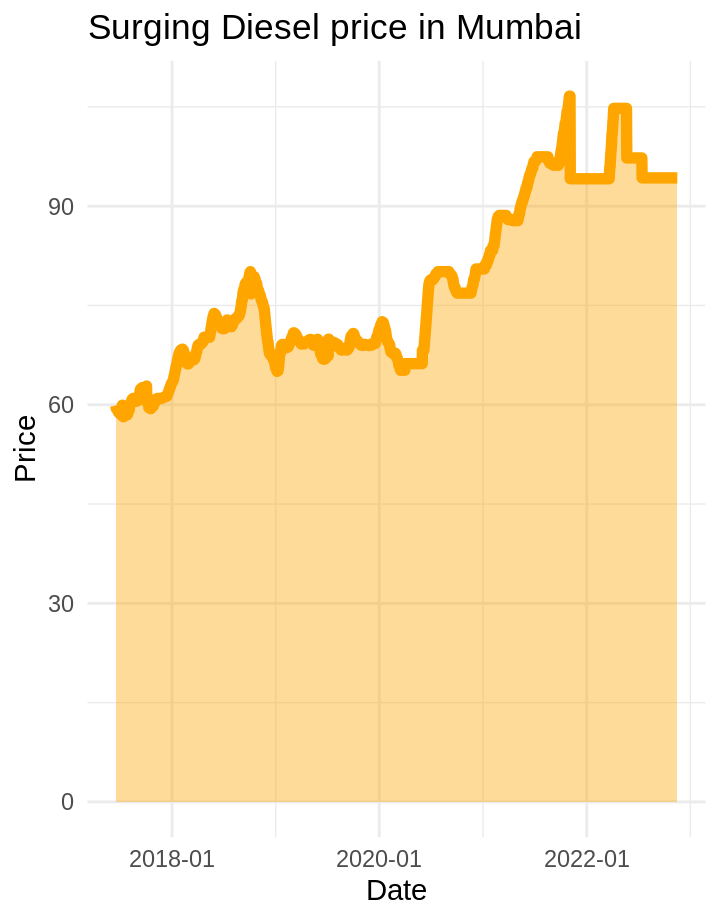
Diesel$Date <- as.Date(Diesel$Date)
Md <- ggplot(Diesel, aes(x = Date, y = Mumbai)) + # Draw ggplot2 plot
geom_area( fill="#FFA500", alpha=0.4) +
geom_line(color="#FFA500", size=2) +
ylab("Price")+
ggtitle("Surging Diesel price in Mumbai")+
scale_x_date(date_labels = "%Y-%m")+
theme_minimal()
Md
```
# Chennai
Row {data-height=350}
-------------------------------------
### Today's Petrol price
```{r}
valueBox(petrol_latest$Chennai,icon = "fa-gas-pump")
```
### Today's Diesel price
```{r}
valueBox(diesel_latest$Chennai,icon = "fa-gas-pump",color = "success")
```
Row {.tabset .tabset-fade}
-------------------------------------
### Petrol Price
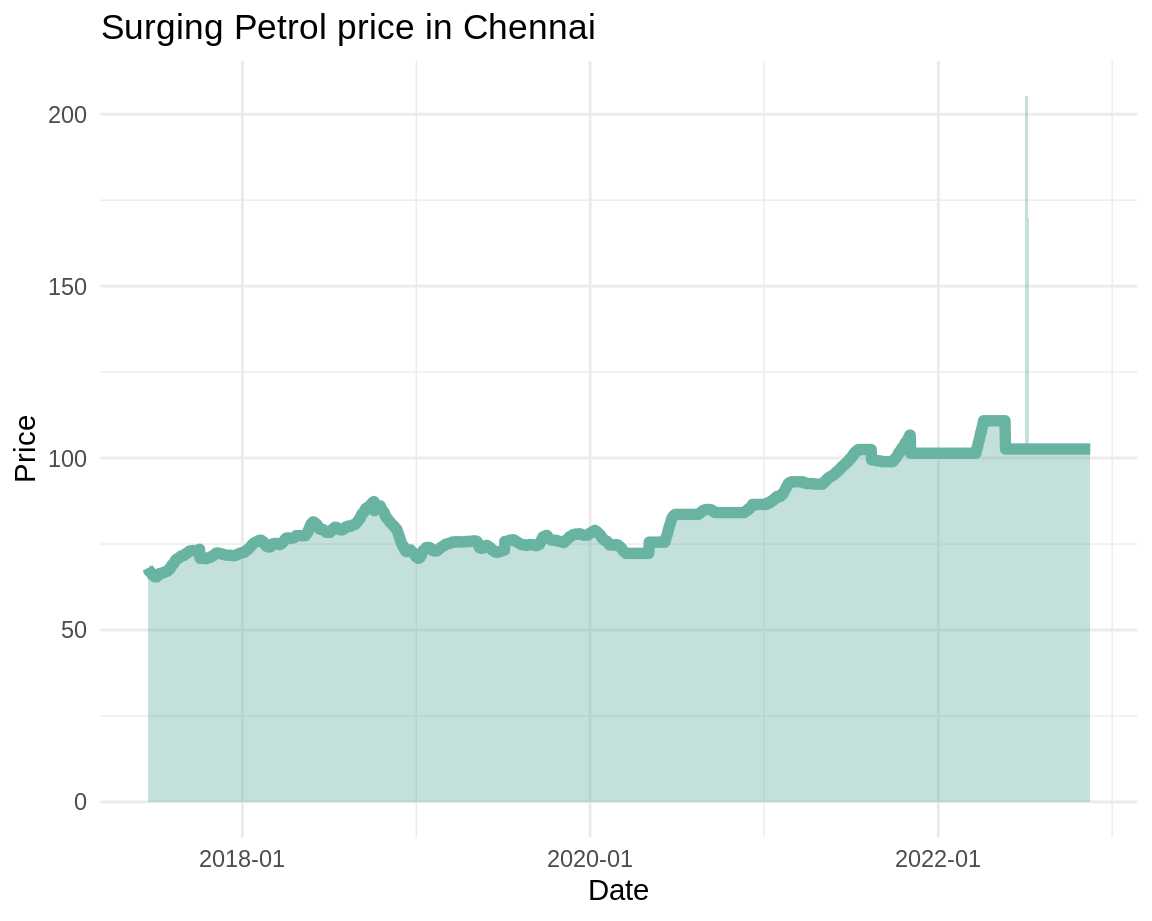
```{r}
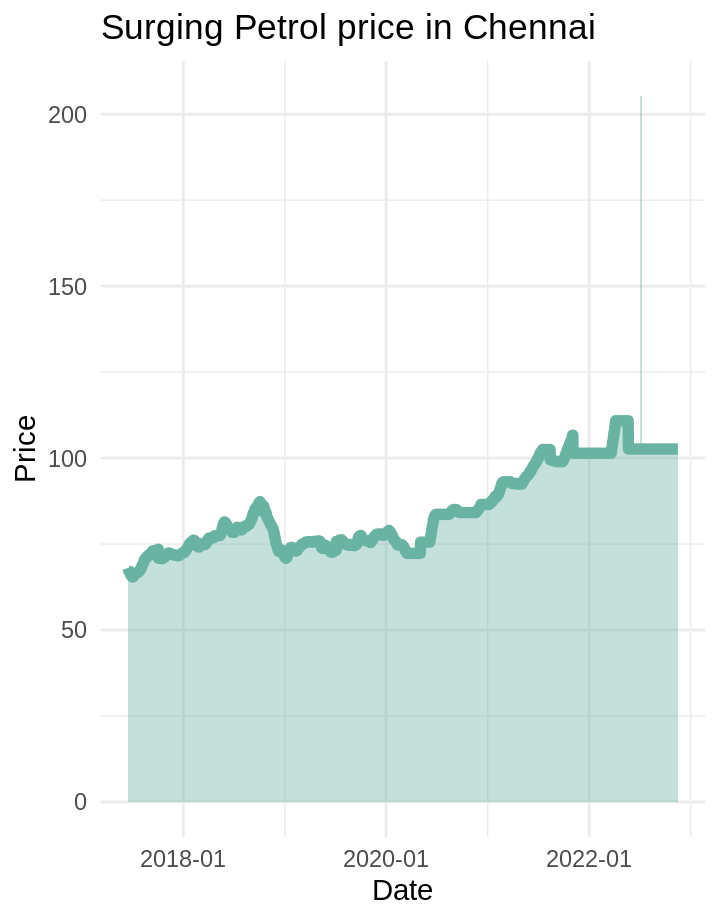
Petrol$Date <- as.Date(Petrol$Date)
Cp <- ggplot(Petrol, aes(x = Date, y = Chennai)) + # Draw ggplot2 plot
geom_area( fill="#69b3a2", alpha=0.4) +
geom_line(color="#69b3a2", size=2) +
ylab("Price")+
ggtitle("Surging Petrol price in Chennai")+
scale_x_date(date_labels = "%Y-%m")+
theme_minimal()
Cp
```
### Diesel price
```{r}
Diesel$Date <- as.Date(Diesel$Date)
Cd <- ggplot(Diesel, aes(x = Date, y = Chennai)) + # Draw ggplot2 plot
geom_area( fill="#FFA500", alpha=0.4) +
geom_line(color="#FFA500", size=2) +
ylab("Price")+
ggtitle("Surging Diesel price in Chennai")+
scale_x_date(date_labels = "%Y-%m")+
theme_minimal()
Cd
```
# Kolkata
Row {data-height=350}
-------------------------------------
### Today's Petrol price
```{r}
valueBox(petrol_latest$Kolkata,icon = "fa-gas-pump")
```
### Today's Diesel price
```{r}
valueBox(diesel_latest$Kolkata,icon = "fa-gas-pump",color = "success")
```
Row {.tabset .tabset-fade}
-------------------------------------
### Petrol Price
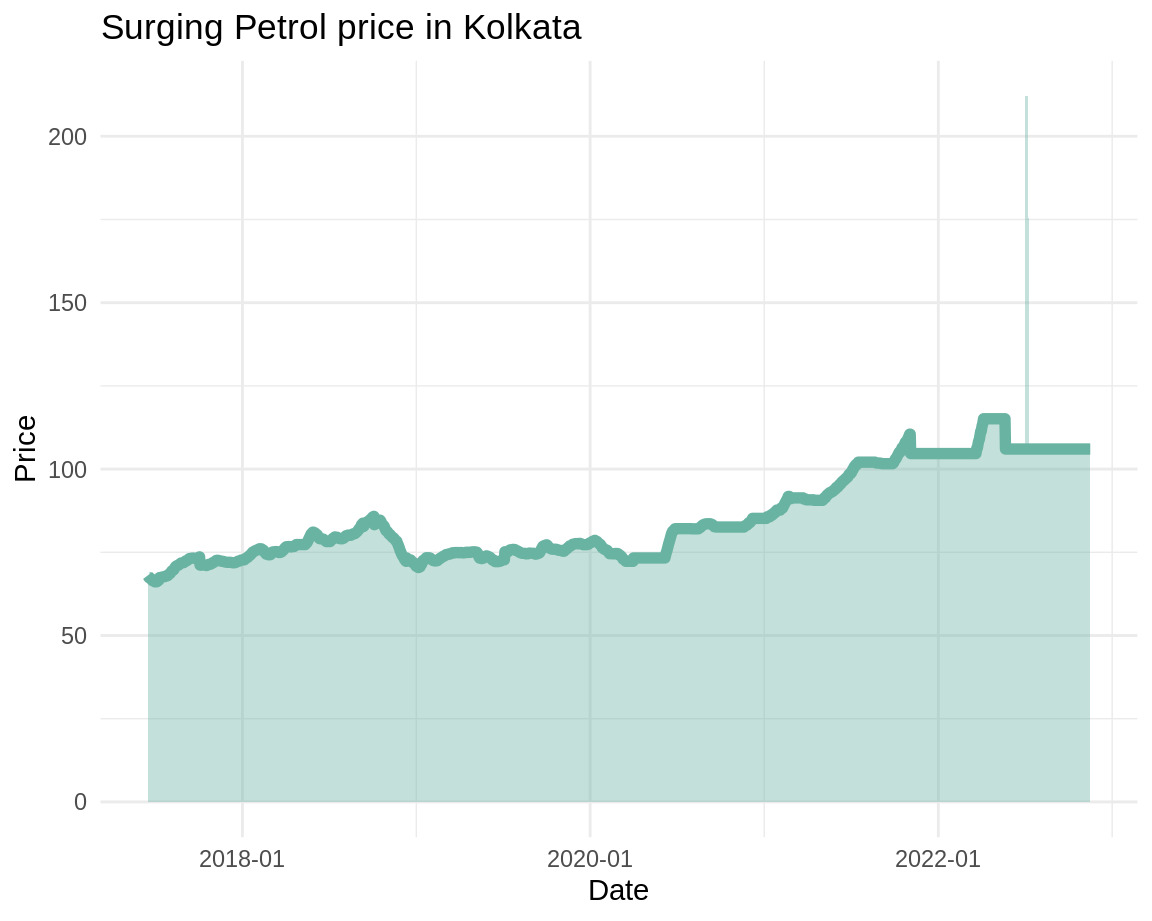
```{r}
Petrol$Date <- as.Date(Petrol$Date)
Kp <- ggplot(Petrol, aes(x = Date, y = Kolkata)) + # Draw ggplot2 plot
geom_area( fill="#69b3a2", alpha=0.4) +
geom_line(color="#69b3a2", size=2) +
ylab("Price")+
ggtitle("Surging Petrol price in Kolkata")+
scale_x_date(date_labels = "%Y-%m")+
theme_minimal()
Kp
```
### Diesel price
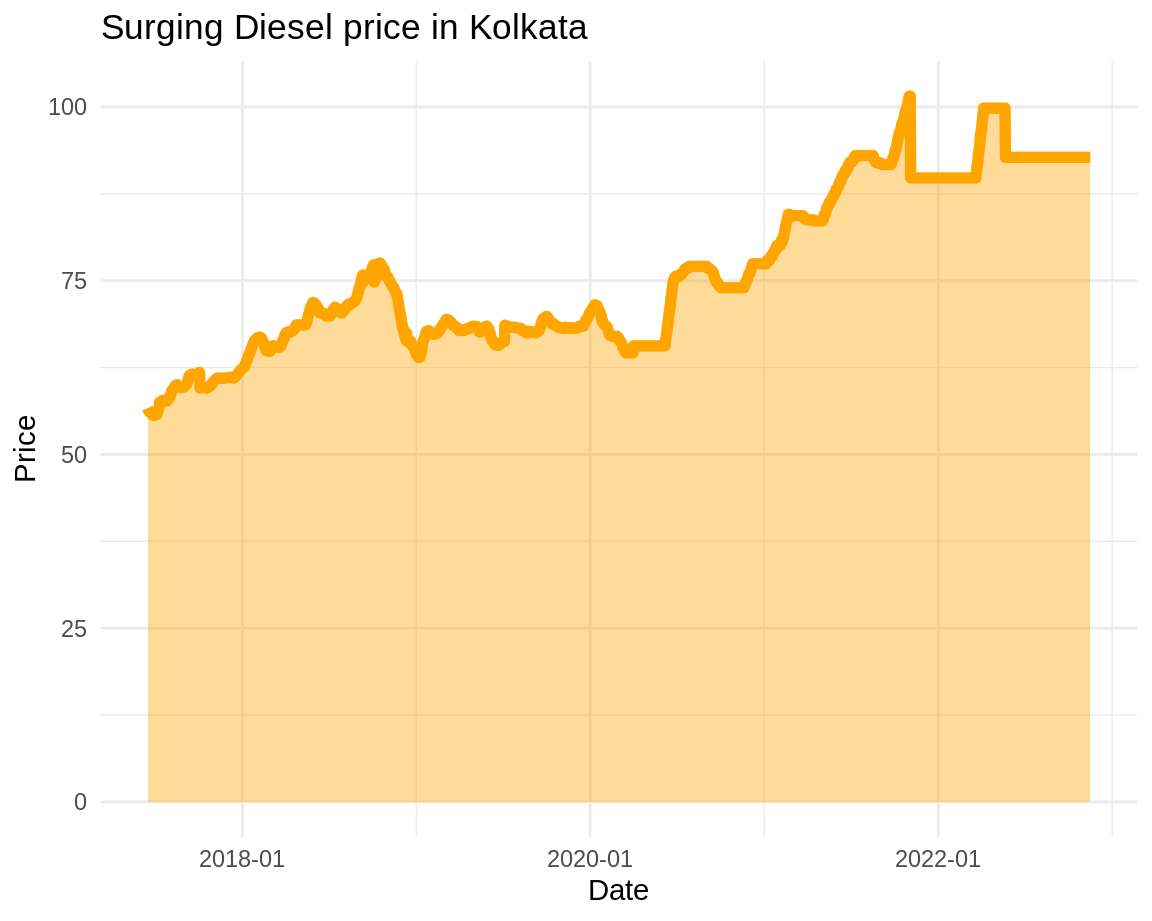
```{r}
Diesel$Date <- as.Date(Diesel$Date)
Kd <- ggplot(Diesel, aes(x = Date, y = Kolkata)) + # Draw ggplot2 plot
geom_area( fill="#FFA500", alpha=0.4) +
geom_line(color="#FFA500", size=2) +
ylab("Price")+
ggtitle("Surging Diesel price in Kolkata")+
scale_x_date(date_labels = "%Y-%m")+
theme_minimal()
Kd
```